Showing posts with label octave. Show all posts

03 March 2013

353. Cygwin with octave and gnuplot on windows XP.

Here's my fourth Windows XP post.

Again, the goal is primarily to get Gnuplot and Octave working on Windows, together with sed, gawk and other tools for data processing. In this post that's done using cygwin on windows XP.

This is (in my opinion) a better alternative to installing the native gnuplot and octave packages (posts 350, 351, 352), especially as Octave in post 350 takes well over a minute to start, but only a few seconds through cygwin.

1. Download http://cygwin.com/setup.exe and run it. Set it to install from the internet, with c:\cygwin as the root directory. Pick a mirror which is reasonably close (e.g. mirror.aarnet.edu.au in Australia).

2. You're now asked to select packages.
Select octave (search for octave, click on 'skip' to change it to the version number), octave-forgegnuplot, xinit and xorg-server

3. Cygwin will calculate dependencies. cat, gawk, sed etc. are part of the base package and don't need to be explicitly selected.

I got a single error during installation, but it doesn't seem to have caused any obvious issues:
Package: libpango1.0_0 pango1.0.sh exit code 1
4. Launch Programs/Cygwin-X/XWin server.
Unblock if necessary.

Do
echo $DISPLAY
:0
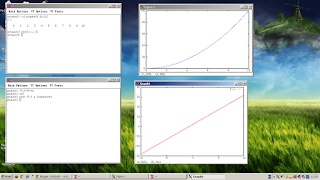
to make sure that all is well. Run gnuplot and do e.g. 'plot x w lines' to make sure that all is working. Best thing? Octave only takes a few seconds to start... You may have to load packages in octave manually (e.g. 'pkg load all')


Links to this post:
http://blog.csdn.net/lllcfr1/article/details/8657143

25 January 2013

327. Installing Octave, Gnuplot, maxima etc on OSX 10.8.2 via macports

Update 7 Feb 2013: Got my hand on a Mac again and sorted out the octave forge packages.

NOTE: while on the surface this has little to do with linux, it IS in our interest to get people on other platforms to use the same tools we do. Or at least compatible ones. So knowing about macports will help even the most die-hard linux user. In fact, it will help especially those.


I'm no friend of Apple, Mac or OS X for many reasons (restrictive environment, weird mouse, their typical target audience), but pragmatism will make you happier than zealotry. What doesn't work for me obviously works for other people.

Students (and professors) at Australian universities do use apple laptops in significant number though (yet our ERP system only works properly with Internet Explorer -- try requesting leave using chrome on linux and you may be in for a surprise) so I've recently been faced with the issue of installing my standard linux tools on students' apple laptops. In fact it's gotten so bad that several Australian universities 'give' ipads to all their students for 'free' (nothing is free when you're paying for it through your tuition). As someone working at a uni I resent this since, by using the one platform where you can't install what you want on it, this puts pressure on me to restrict my teaching to what can be had via the almighty app store. (there's a lot of BS about blended learning, and you'd be lucky to find a white board anywhere. Blackboards are completely gone which is idiocy of the first degree)

Anyway. There's plenty of people here using Macbook-thingies and it's in my own interest to get them on the narrow path to justice, liberty and the FOSS way.

Macports is a really cool package manager/repository for linux software for Mac OSX and works by compiling the software from the sources -- pretty much how I imagine that the Gentoo experience may be like. Anyway, it works fine although it takes a fair amount of time to install things.


So here's how to do it (no screenshots because I'm typing this from memory):
  1. Open the App Store and install XCode (free)
  2. Open Xcode, go to Preferences/Download, and install Command Line Tools
  3. Download macports via this link for OS X 10.8: https://distfiles.macports.org/MacPorts/MacPorts-2.1.2-10.8-MountainLion.pkg
    Other versions of OS X are also supported, see here: http://www.macports.org/install.php
  4. Install the downloaded macports by opening the .pkg file
  5. Open a Terminal window  (Applications/Utilities/Terminal) and run
  6. sudo port -v selfupdate
  7. Run
  8. sudo port install gnuplot maxima vim nano xterm
    which will take a while -- it needs to set up the build environment from scratch in addition to regular dependencies. Set aside an hour or so just in case. If there's an error, try running the command once more.

  9. Run
  10. sudo port install octave-devel qtoctave-mac
    which will take a long while. If the compile seems to have stopped, checked the titlebar of the terminal window -- the command it's executing will continously change during the compile)

  11. Run octave by running the command
    octave
    in the terminal.
  12. To install octave packages you can install them in the Octave environment :
    pkg install -forge miscellaneous struct general optim
  13. addpath
  14. In case you're having problems actually using the octave-forge packages, you might need to create/edit your ~/.octaverc along the lines of
    addpath('/Users/verahill/octave/optim-1.2.2')
    Replace verahill with the proper user name, and edit the version number as needed.

  15. X11/Xquartz - setting DISPLAY
  16. At this point
    echo $DISPLAY
    gave nothing, and trying to launch an X11 program (e.g. xterm) complained that DISPLAY was not set. Setting DISPLAY manually (export DISPLAY=:0.0) didn't help either.

    'Bad' solution: the first solution was to install xorg-server (sudo port install xorg-server), and then manually
    X &
    export DISPLAY=:0.0
    
    or
    Xquartz &
    export DISPLAY=:0.0
    
    Both X and Xquartz come from macports.

    Good solution
    I then tried to change tack and went to http://xquartz.macosforge.org/landing/ and downloaded XQuartz-2.7.4.dmg (I was originally under the impression that it came as default with "mountain lion" but no.).
    Open the file, then run the .pkg file in that archive. Log out of OSX, then log in again. Now try launching e.g. xterm form a terminal and it should work.


The entire process will take well over an hour, but at the end of it you'll have Octave, Gnuplot AND a complete build environment!

And there are plenty more things you can install with macports (e.g. qtoctave (qtoctave-mac), gedit (gedit gedit-plugins), kile, maxima, qtiplot).

Not sure why I am so excited over it since all these things are available in most linux repos, but there you go -- compiling stuff is ALWAYS exciting.

19 December 2012

294. Bruker 1D processing using octave/matlab

I wanted a set of scripts that behaved a little bit like the commands in bruker xwin-nmr/topspin, so that I could do some quick processing for visual inspection without having to do too much coding.

I also wanted some simple modules that I can plug into automated processing routines for large numbers of spectra (e.g. when doing kinetics).

So here are a few simple octave routines which should work in matlab as well. They won't change the world, but should be good enough for some basic 1D processing.

Because of the groupdelay (GRPDLY) used in by Bruker (see e.g. here (16th of June post) and here), you need to use the bruk2ana converter. There's little science behind the values which are applied since they are hardware specific.


Example workflow:

./bin2ascii experiment_1/1 fid
getpar experiment_1/1 my.par

octave:1> [fid,pars]=loadfid('fid.ascii','my.par');
octave:2> [zfid,pars]=zf(fid,pars);
octave:3> [test,phc1]=bruk2ana(zfid,pars);
octave:4> test=em(test,0.5);
octave:5> plot(test(:,1),test(:,3));
octave:6> spectrum=ft(test,pars);
octave:7> phased=apk(spectrum,phc1);
octave:8> final=absd(spectrum);
octave:9> pltspec(final)


Linux shell-scripts

bin2ascii
#!/bin/bash
#bin2ascii dir fid
cp $1/$2 $1/$2.bak
ls $1/$2.bak | cpio -o | cpio -i --swap -u
od -An -t dI -v -w8 $1/$2.bak| gawk '{print NR,$1,$2}' > $2.ascii

getpars
 #!/bin/bash
 #getpars $1 $2
 # $1 is the location (directory or .) and $2 is the root of the output file name
 SW=`cat $1/acqus | grep 'SW_h' | sed 's/\=/\t/g' | gawk '{print $2}'| tr -d '\n'`
 TD=`cat $1/acqus | grep 'TD=' | sed 's/\=/\t/g' | gawk '{print $2}'| tr -d '\n'`
 O=`cat $1/acqus | grep '$O1=' | sed 's/\=/\t/g' | gawk '{print $2}'`
 SFO=`cat $1/acqus | grep 'SFO1=' | sed 's/\=/\t/g' | gawk '{print $2}'`
 DECIM=`cat $1/acqus | grep 'DECIM=' | sed 's/\=/\t/g' | gawk '{print $2}'`
 DSPFVS=`cat $1/acqus | grep 'DSPFVS=' | sed 's/\=/\t/g' | gawk '{print $2}'`
 echo $SW > $2
 echo $TD >> $2
 echo $O >> $2
 echo $SFO >> $2
 echo $DECIM >> $2
 echo $DSPFVS >> $2

Octave scripts

loadfid.m
function [fid,pars]=loadfid(infile,parfile)
%%Usage: [fid,pars]=loadfile(infile,parfile)
%%reads a pts, re, im ascii array 
%%generated by bin2ascii
%%and a parfile generated with genpar
 fid=load(infile);
 pars=load(parfile);
 t=linspace(0,(1/(pars(1)/(pars(2)/2))),pars(2)/2);
 fid=[t' fid(:,2) fid(:,3)];
end

zf.m
function [newfid,pars]=zf(fid,pars)
%% Usage:[newfid,updatedpars]=zf(fid,pars)
%% Doubles the number of points by zerofilling
 dims=size(fid);
 newfid=[fid' zeros(3,dims(1))]';
 pars(2)=pars(2)*2;
end

bruk2ana
function [fid,phc1]=bruk2ana(fid,pars)
%% Usage: [fid,phc1]=bruk2ana(fid,pars)
%% where phc1 is the first-order phase correction
%% Using https,//nmrglue.googlecode.com/svn-history/r44/trunk/nmrglue/fileio/bruker.py
%% and https,//ucdb.googlecode.com/hg/application/ProSpectND/html/dmx_digital_filters.html
%% The short version is: bruker fid data needs pre-processing and it's hardware dependent

%%D contains the digital filter parameters
D=[[10,2, 44.75];
[10,3, 33.5];
[10,4, 66.625];
[10,6, 59.083333333333333];
[10,8, 68.5625];
[10,12, 60.375];
[10,16, 69.53125];
[10,24, 61.020833333333333];
[10,32, 70.015625];
[10,48, 61.34375];
[10,64, 70.2578125];
[10,96, 61.505208333333333];
[10,128, 70.37890625];
[10,192, 61.5859375];
[10,256, 70.439453125];
[10,384, 61.626302083333333];
[10,512, 70.4697265625];
[10,768, 61.646484375];
[10,1024, 70.48486328125];
[10,1536, 61.656575520833333];
[10,2048,70.492431640625];
[11,2, 46.];
[11,3, 36.5];
[11,4, 48.];
[11,6, 50.166666666666667];
[11,8, 53.25];
[11,12, 69.5];
[11,16, 72.25];
[11,24, 70.166666666666667];
[11,32, 72.75];
[11,48, 70.5];
[11,64, 73.];
[11,96, 70.666666666666667];
[11,128, 72.5];
[11,192, 71.333333333333333];
[11,256, 72.25];
[11,384, 71.666666666666667];
[11,512, 72.125];
[11,768, 71.833333333333333];
[11,1024, 72.0625];
[11,1536, 71.916666666666667];
[11,2048, 72.03125];
[12,2, 46. ];
[12,3, 36.5];
[12,4, 48.];
[12,6, 50.166666666666667];
[12,8, 53.25];
[12,12, 69.5];
[12,16, 71.625];
[12,24, 70.166666666666667];
[12,32, 72.125];
[12,48, 70.5];
[12,64, 72.375];
[12,96, 70.666666666666667];
[12,128, 72.5];
[12,192, 71.333333333333333];
[12,256, 72.25];
[12,384, 71.666666666666667];
[12,512, 72.125];
[12,768, 71.833333333333333];
[12,1024, 72.0625];
[12,1536, 71.916666666666667];
[12,2048, 72.03125];
[13,2, 2.75]; 
[13,3, 2.8333333333333333];
[13,4, 2.875];
[13,6, 2.9166666666666667];
[13,8, 2.9375];
[13,12, 2.9583333333333333];
[13,16, 2.96875];
[13,24, 2.9791666666666667];
[13,32, 2.984375];
[13,48, 2.9895833333333333];
[13,64, 2.9921875];
[13,96, 2.9947916666666667];];

 h=find(D(:,2)==pars(5));
 j=find(D(h,1)==pars(6));
 magickey=D(h(j),3);
 chop=floor(magickey);

 phc1=(magickey-chop)*2*pi; %the first-order phase correction gets mangled by bruker

 tmp=size(fid); %matlab workaround. rows/columns would be more elegant
 
 newfid=[fid(chop:tmp(1),2:3)' fid(1:chop-1,2:3)']';
 fid=[fid(:,1) newfid(:,1) newfid(:,2)];
 
end

em.m
function fid=em(fid,lb)
%%Usage: fid=em(fid,lb)
%%Exponential multiplication window function
%%Increases Signal-to-noise at the expense
%%of resolution
 fid(:,2)=fid(:,2).*exp(-lb.*fid(:,1));
 fid(:,3)=fid(:,3).*exp(-lb.*fid(:,1));
end

gm.m
function fid=gm(fid,lb)
%%Usage: fid=gm(fid,lb)
%%Gaussian multiplication window function
%%Increases Signal-to-noise at the expense
%%of resolution
 fid(:,2)=fid(:,2).*exp(-(lb.*fid(:,1)).^2);
 fid(:,3)=fid(:,3).*exp(-(lb.*fid(:,1)).^2);
end

de.m
function fid=de(fid,lb,gm)
%%Usage fid=de(fid,lb,gm)
%%Double-exponential window function
%%Increases resolution at the expense of
%%signal-to-noise
 at=max(fid(:,1));
 defun= @(lb,gm,t) (exp(-(t.*lb-gm*at))).^2;
 fid(:,2)=fid(:,2).*defun(lb,gm,fid(:,1));
 fid(:,3)=fid(:,3).*defun(lb,gm,fid(:,1));
end

traf.m
function fid=traf(fid,lb)
%%Usage: fid=traf(fid,lb)
%%TRAF window function
%%Increases resolution at the expense of
%%the signal-to-noise
 at=max(fid(:,1));
 traffun= @(lb,t) (exp(-t.*lb)).^2./((exp(-t.*lb)).^3+(exp(-at*lb)).^3);
 fid(:,2)=fid(:,2).*traffun(lb,fid(:,1));
 fid(:,3)=fid(:,3).*traffun(lb,fid(:,1));
end

ft.m
function spectrum=ft(fid,pars)
%%Usage: spectrum=ft(fid,pars)
%% Spectrum is a complex array with the frequency in
%%the first column and the real and imaginary parts
%%in the second column
%%pars(3)=centrefreq, pars(1)=SW
 spectrum=fftshift(fft(fid(:,3)+i*fid(:,2)));
 tmp=size(spectrum);%matlab workaround
 freq=linspace(pars(3)+pars(1)/2,pars(3)-pars(1)/2,tmp(1));
 spectrum=[freq' spectrum];
endfunction

apk.m
function spectrum=apk(spectrum,phc1)
%%Usage spectrum=apk(spectrum,phc1)
%%Spectrum is a complex matrix with
%%the frequency in the first column
%%and the complex spectrum in the 
%%second column. phc1 is the first order
%%phase correection

 tmp=size(spectrum);
 m=720;
 ph=linspace(-2*pi,2*pi,m);
 maxsig=0;k=1;
 minsig=-inf;
 for n=1:m;
  spex=real( (spectrum(:,2)).*exp(i*(ph(n)+phc1*i/tmp(1))) );
  localmin=min(spex);
        localmax=max(spex);
        if (localmin>minsig) 
                minsig=localmin;
                k=n;
        end
 end
 ph0=ph(k);
 spectrum(:,2)=spectrum(:,2).*exp(i*(ph0+phc1*i/tmp(1)));
end

altapk.m
function [spectrum,ph]=altapk(spectrum,phc0,phc1)
%%Usage -spectrum,ph]=altapk(spectrum,phc0,phc1)
%%Spectrum is a complex matrix with the frequency in the first column
%%and the complex spectrum in the second column. phc0 and phc1 are the first order
%%phase correction parameters, respectively, and are used as initial guesses.
%%This is an implementation of Chen, Weng, Goh and Garland, J. Mag. Res., 2002, 158, 164-168 and depends on entropy.m.

    ph=[phc0;phc1];
        ph=minimize("entropy",{ph,spectrum});

        %compute spectrum with optimal phase params
        pts=linspace(1,size(spectrum(:,2),1),size(spectrum(:,2),1));
        phi=(ph(1)+ph(2).*pts./max(pts))';
        spectrum(:,2)=spectrum(:,2).*exp(i*phi);
end

entropy.m
function E=entropy(ph,spectrum)
%%Used by altapk.m
    pts=linspace(1,size(spectrum(:,2),1),size(spectrum(:,2),1));
        penalty=5.53;

    phi=(ph(1)+ph(2).*pts./max(pts))';
        size(phi);
        spectrum(:,2)=spectrum(:,2).*exp(i*phi);
        R=real(spectrum(:,2));
        size(R);
    Rm=firstderiv(R);
        size(Rm);
    h=abs(Rm)/sum(abs(Rm));
        size(h);

        negs= imag((R).^(1/2));
        negs(find(negs>1))=1;
    P= @(R) penalty.*sum((negs).*R.^2);

    E=-sum(h.*log(h))+P(R);
end

absd.m
function spectrum=absd(spectrum)
%%Usage spectrum=absd(spectrum)
%%Simple (linear) baseline correction
        bsline=@(m) sum(abs(real(spectrum(:,2))-m));
        guess=0;
        p=0;
        newm=minimize(bsline,p);
        spectrum(:,2)=spectrum(:,2)-newm;
end

pltspec.m
function pltspec(spectrum)
%%Usage: pltspec(spectrum)
%%Where spectrum is a complex matrix
%%with the frequency in the first column
%%and the complex spectrum (a+i*b) in the
%%second column
 plot(spectrum(:,1),real(spectrum(:,2)))
end

29 September 2012

249. Quick but precise isotopic pattern (isotope envelope) calculator in Octave

UPDATE: Below is an accurate calculator,  but it is impractically slow for large molecules. A practical AND accurate calculator is found here:http://verahill.blogspot.com.au/2012/10/isotopic-pattern-caculator-in-python.html

Use the post below to learn about the fundamental theory, but then look at the other post to understand how to implement it.

Old post:
Getting fast and accurate isotopic patterns can be tricky using tools available online, for download or which form part of commercial packages. A particular problem is that different tools give slightly different values -- so which one to trust?

The answer: the tool for which you know that the algorithm is sound.

The extreme conclusion of that way of thinking is to write your own calculator.
Below is the conceptual process of calculating the isotopic pattern of a molecule using GNU Octave.

You need the linear algebra package:
sudo apt-get install octave octave-linear-algebra

b is the isotopic distribution for an element, and bb are the masses of those isotopes.

Once you've got a computational engine it's not too difficult to expand it for more general cases, account for charge, and instrument resolution.


Molecule: Cl4

b=[0.7578,0.2422];
bb=[34.96885,36.96885];
e=prod(cartprod(b,b,b,b),2);
ee=sum(cartprod(bb,bb,bb,bb),2);
n=4;
g=histc([ee e],linspace(min(ee),max(ee),n*(max(ee)-min(ee)+1)),2);
h=linspace(min(ee),max(ee),n*(max(ee)-min(ee)+1));
distr=e'*g;
plot(h,100.*distr/max(distr))
[h' (100.*distr/max(distr))']
Here's the output for n=1:
   139.87540    78.22048
   140.87540     0.00000
   141.87540   100.00000
   142.87540     0.00000
   143.87540    47.94141
   144.87540     0.00000
   145.87540    10.21502
   146.87540     0.00000
   147.87540     0.81620

And here's the output from Matt Monroe's calculator:
Isotopic Abundances for Cl4
  Mass/Charge Fraction  Intensity
   139.87541 0.3297755   78.22
   140.87541 0.0000000    0.00
   141.87541 0.4215974  100.00
   142.87541 0.0000000    0.00
   143.87541 0.2021197   47.94
   144.87541 0.0000000    0.00
   145.87541 0.0430662   10.22
   146.87541 0.0000000    0.00
   147.87541 0.0034411    0.82


Another molecule: Li2Cl2

Here's the code:
a=[0.0759,0.9241];
aa=[6.01512,7.01512];
b=[0.7578,0.2422];
bb=[34.96885,36.96885];
e=prod(cartprod(a,a,b,b),2);
ee=sum(cartprod(aa,aa,bb,bb),2);
n=1;
g=histc([ee e],linspace(min(ee),max(ee),n*(max(ee)-min(ee)+1)),2);
h=linspace(min(ee),max(ee),n*(max(ee)-min(ee)+1));
distr=e'*g;
plot(h,100.*distr/max(distr))
[h' (100.*distr/max(distr))']

ans =

    81.96794     0.67170
    82.96794    16.35626
    83.96794   100.00000
    84.96794    10.45523
    85.96794    63.71604
    86.96794     1.67079
    87.96794    10.17116

vs Matt Monroe's calculator:
Isotopic Abundances for Li2Cl2
  Mass/Charge Fraction  Intensity
    81.96795 0.0033082    0.67
    82.96795 0.0805564   16.36
    83.96795 0.4925109  100.00
    84.96795 0.0514932   10.46
    85.96795 0.3138084   63.72
    86.96795 0.0082288    1.67
    87.96795 0.0500941   10.17

We can then expand the code to allow for plotting
a=[0.0759,0.9241];
aa=[6.01512,7.01512];
b=[0.7578,0.2422];
bb=[34.96885,36.96885];
e=prod(cartprod(a,a,b,b),2);
ee=sum(cartprod(aa,aa,bb,bb),2);
n=1;

g=histc([ee e],linspace(min(ee),max(ee),n*(max(ee)-min(ee)+1)),2);
h=linspace(min(ee),max(ee),n*(max(ee)-min(ee)+1));
distr=e'*g;
gauss= @(x,c,r,s) r.*1./(s.*sqrt(2*pi)).*exp(-0.5*((x-c)./s).^2);
k=100.*distr/max(distr);

npts=1000;
resolution=0.25;

x=linspace(min(ee)-1,max(ee)+1,npts);
l=cumsum(gauss(x,h',k',resolution));
l=100*l./max(l(rows(l),:));
plot(x,l(rows(l),:))

which gives:

Compare with Matt Monroe's calculator:

14 June 2012

191. Thinking about Molecular volume -- and is cosmo/nwchem yielding the right ones?

Disclaimer:
I'm an neither a theoretical nor computational chemist. I'm an analytical/inorganic chemist who likes computers. Don't trust my conclusions. This is more like thinking aloud.

The problem:
The underlying impetus is that of molecular volume: if we have a set of scatter points in space which define the surface of a molecule, how can we extract the volume? In particular as we're actually given the surface points by in the form of a cosmo.xyz file by COSMO (and yes, nwchem also outputs a volume - more about that later) there's no reason why we won't do the calculations ourselves. Also, there's at least one example of comparing results from a few major software packages, where nwchem was the odd one out.

Because it's good to know how to use Octave and bash, I'll show the commands as well.

The COSMO parameters used were
cosmo
    rsolv 0
end

[come to think of it: why bother with
and nwchem returned

 atomic radii =
 --------------
    1  6.000  2.000
    2  6.000  2.000
    3  6.000  2.000
    4  6.000  2.000
    5  6.000  2.000
    6  6.000  2.000
    7  1.000  1.300
    8  1.000  1.300
    9  1.000  1.300
   10  1.000  1.300
   11  1.000  1.300
   12  1.000  1.300
and a volume of ca 74.5 Ã…3

Processing:
me@Be:~$ head cosmo.xyz 
                  325
 cosmo charges
 Bq   2.1848085582473193      -0.38055253987610238        1.5251498369435705       -9.3089382062078174E-004
 Bq   1.6134835908159706      -0.59877925881345084        1.8782480854375714       -3.3706153046646758E-003
 Bq  0.43449121346899733      -0.59877925881345084        1.8782480854375714       -3.9739778624157118E-003
 Bq   1.0239874021424840      -0.23823332776127137        1.8683447179254316       -1.6433149723942275E-003


OK, we need to remove the first two lines, and the first column.
me@Be:~$ tail -n +3 cosmo.xyz|gawk '{print $2,$3,$4,$5}'> cos2.xyz
Start octave.
octave:1> bz=load('cos2.xyz');
octave:2> x=bz(:,1);y=bz(:,2);z=bz(:,3);c=bz(:,4);
octave:3> plot3(x,y,z)

Paradoxically, this would be fairly easy to do with a 'normal-size' physical object (e.g. water displacement, or area on a 2D project: draw it, cut it out, weigh it and use the density of the paper)

 Computationally, we need to think about it though. The most logical approach seems to be to take all x,y data points with a small range of values of z=zi±dz, project them on a 2D surface, calculate the area within, and multiply it by dz. Do this for all values of z.
octave:4> plot(y,z,'*')


But how to calculate the area inside an arbitrary two-dimensional figure then? If we can pick a point in the 'centre' of the figure, we can draw repeated triangles with this point as one of the corners. It's easy to calculate the area of a triangle, so we just need to sum the areas of the triangles. All we need to know is how to find such a central point to use as a corner. Also, there are problems when dz is too large and the 'border' becomes fuzzy.
octave:5> plot(y(1:25),z(1:25),'*')

In fact, at this stage there may well be pre-canned algorithms to help us.
octave:6>H=convhull(y(1:25),z(1:25));
octave:7>plot(y(H),z(H))
octave:8>hold
octave:9>plot(y(1:25),z(1:25),'*')

That way we can reduce the number of points to the ones defining the encircling figure.
octave:10>area(y(H),z(H))


That still doesn't give us the area (I think matlab does though). Since it's centred around the x axis we could probably use cumsum(abs(z(H))), but that's not general enough. In fact, there'd be so much  quality analysis required in order to make sure that we include enough, but not too many, points in our slices that it quickly becomes a chore.

So we'll take a step back. Turns out it's even easier:
octave:11>[H V]=convhulln([x y z]);
This probably isn't how you're supposed to plot it, but it works:
octave:13>trisurf(H,x,y,z)

trisurf plot
octave:12>V
gives V=104.07  Ã…3 (c.f. Nwchem/cosmo ca 74.5 Ã…3 for rsolv=0.)

Now that doesn't look good, but it has been noted nwchem/cosmo gives volumes which are about half of what every other program gives. See here and here:

">Cosmo produced volumes, which were twice as small
> as those obtained by PCM, while surfaces where by about 15% bigger in
> Cosmo."

I think nwchem actually isn't returning values of the wrong magnitude -- I think the value returned by nwchem is the molecular volume, while the other programmes return the solvent accessible surface-based volume. But what is in cosmo.xyz?

It appears to be a little bit more complex than that though.


We can open the cosmo.xyz file in jmol, but calculating the volume from these would be meaningless due to the way jmol works.

Instead we'll have to use the VdW radii of the xyz coordinates of the (unoptimised) molecule:


$ isosurface sasurface 0.5 volume
isosurface1 created with cutoff=0.0; isosurface count: 1
isosurfaceVolume = 141.06999
$ isosurface sasurface 0.225 volume
isosurface1 created with cutoff=0.0; isosurface count: 1
isosurfaceVolume =104.452415
$ isosurface solvent 0 volume
isosurface1 created with cutoff=0.0; isosurface count: 1
isosurfaceVolume = 79.09731
$ isosurface solvent volume
isosurface1 created with cutoff=0.0; isosurface count: 1
isosurfaceVolume = [80.26721490808025]
$ isosurface molecular volume
isosurface2 created with cutoff=0.0; isosurface count: 2
isosurfaceVolume = [80.58888982478977]
$ isosurface sasurface 0.2 area
isosurface1 created with cutoff=0.0; isosurface count: 1
isosurfaceArea = 118.730934
Making sense?

sasurface generates a solvent accessible surface. We can generate a value similar to what we saw from the cosmo.xyz points by forcing the sasurface probe radius..

The vdw radii of H and C are 1.2 and 1.7 Ã…, but COSMO uses 1.3 and 2.0.

Look at this plot again:


The height goes from -2 to 2, which agrees with the large 2.0 Ã… VDW radius for C that COSMO uses. The volume outputted by Nwchem is the molecular volume (as actually is stated). 
 number of -cosmo- surface points =      176
 molecular surface =    125.008 angstrom**2
 molecular volume  =     74.512 angstrom**3
(electrostatic) solvation energy =         0.0052128678 (    3.27 kcal/mol)
The molecular volume for rsolv=0 is 74.5 Ã…3 which is fairly close to isosurface sasurface 0 volume. Area is trickier, and requires isosurface sasurface 0.23 volume to yield anything close.

I don't think it's a coincidence that isosurface sasurface 0.225 volume gives a reasonable agreement with the cosmo.xyz, since 1.7+0.225=1.925 which is ca 2 (we only add 0.1 for H).

I'm sure all this is in the manual somewhere. But there's nothing like learning through doing.

The conclusions:
* NWchem returns a volume based on the vdw radii, not the solvent cavity
* cosmo.xyz contains points defining the surface according to the vdw radii that cosmo uses
* These are two different sets of vdw radii
* You can't compare the output of different software packages if they aren't outputting the same data
* The reported NWChem volume does depend on rsolv, the cosmo vol doesn't
* The cosmo.xyz volume is insensitive to rsolv, but sensitive to radius as expected. As far as I understand, the cosmo volumes are based solely on the vdw radii (as supplied to cosmo)
* I haven't quite figured out how, but looking at the dependency of rsolve vs defining vdw radii for cosmo, the radii used to calculate the nwchem volume is is certainly affected.

Increase rsolv=0.0, increase vdw +0.0: 74.51/104.07/3.27
Increase rsolv=0.5, increase vdw +0.0: 58.0/103.96/3.01
Increase rsolv=1.0, increase vdw +0.0: 54 /103.87/2.95
Increase rsolv=0.0, increase vdw +0.1: 84.79/115.10/2.72
Increase rsolv=0.1, increase vdw +0.1: 82.68/115.10/2.63
Increase rsolv=0.27, increase vdw +0.1: 71.84/114.97/2.56
Increase rsolv=0.0, increase vdw +0.2: 96.59/126.83/2.22
Increase rsolv=0.1, increase vdw +0.2: 85.70/126.68/2.09
increase rsolv=0.70, increase vdw +0.2: 74.68/126.56/2.01

My only real conclusion at this point is that you have to be extremely careful about what you do. This is not easy.


A Certain Commercial Programme (ACCP):
Using pcm:

scrf=(pcm,solvent=water) -- this uses vdw radii.
GePol: Cavity volume                                =      134.665 Ang**3
GePol: Cavity surface area                          =    143.132 Ang**2
Let's see if we can do this in jmol:
$ isosurface sasurface 0.5 area
isosurface1 created with cutoff=0.0; isosurface count: 1
isosurfaceArea = 144.25595
$ isosurface sasurface 0.46 volume
isosurface1 created with cutoff=0.0; isosurface count: 1
isosurfaceVolume = 135.33589
PCM is less of a mystery now.

ACCP has a few more options though.
Using IPCM with 50 points. This uses the isodensity volume.
Volume of Solute Cavity = 8.026500E+02
Total "Solvent Accessible Surface Area" of Solute = 4.485628E+02
I've been told that the units are in Bohr3 and Bohr2. That translates to 118.94 Ã…3 and 125.61Ã…3, respectively, which sounds about right. 

06 June 2012

177. Jerry-rigging g09 UV/VIS spectra in gnuplot and/or octave

EDIT: I had a nicer post with lots of figures before. Because I realised that the data is good enough to be included in a future paper we're working on, I had to take everything down again. All the data in the plots now is made up (hence 'fakeuv.dat'), and I haven't made the plots look nice.

I don't like proprietary formats for anything. They never, ever benefit anyone other than the software vendor.

Almost as bad as using binary proprietary formats is not providing export facilities to ascii formats.

I may have missed it, but I was using gaussview to look at td-dft calculated uv/vis spectra -- and couldn't find a way of exporting the data. Sure, I could export the graph as a png, svg etc. file. But not double column tab-separated ascii file.

There's a bit of fudging in what I'm doing  -- I'll be the first one to admit that.

So here's single line to export the wavelengths and intensities:
cat g03.g03out|grep Excited|grep -v singles|sed 's/=/\t/g'|gawk '{print $7,$10}'>uvvis.dat

You can plot them in gnuplot using
plot 'uvvis.dat' u 1:2 w impulse

The problem is that these are just spikes -- not the smooth uv/vis like spectra we're used to. On the other hand, if I understand things correctly, this is the REAL data, while the smoothed uv/vis spectrum above is more for presentation purposes. I might obviously be wrong, and I am by no stretch a computational or theoretical chemist - I just like their tools.

We've got an immensely powerful tool at our hands: Octave!
data=load('fakeuv.dat');
gauss= @(x,c,r,s) r.*1./(s.*sqrt(2*pi)).*exp(-0.5*((x-c)./s).^2)
x=linspace(250,850,600);
plot(x,cumsum(gauss(x,data(:,1),data(:,2),20)))

where 20 is an abitrary value. Anyway, this is how it looks:
We can try s=30 instead:

We export it
outdata=cumsum(gauss(x,data(:,1),data(:,2),30));
exportdata=[x' outdata'];
save 'uvvis2.sim' exportdata
and plot it in gnuplot
plot 'uvvis2.sim' u 1:48 w lines
It might not look like the UV/VIS spectrum you're used to, but as I said in the beginning, the data's all made up -- using 'real' calculated data I got a beautiful spectrum.

20 July 2011

7. Processing 1D Bruker nmr data

Bruker 1D binary NMR files can be processed using a combination of cat, grep, sed, gawk and od, together with python and octave (w/ octave-optim) for some fancy line-fitting.

 brukdig2asc:
 #!/bin/bash
#usage: brukdig2asc
SW=`cat acqus | grep 'SW_h' | sed 's/\=/\t/g' | gawk '{print $2}'| tr -d '\n'`
TD=`cat acqus | grep 'TD=' | sed 's/\=/\t/g' | gawk '{print $2}'| tr -d '\n'`
O=`cat acqus | grep '$O1=' | sed 's/\=/\t/g' | gawk '{print $2}'`
SFO=`cat acqus | grep 'SFO1=' | sed 's/\=/\t/g' | gawk '{print $2}'`
#TIME=16384
#SWEEP=23809.5238095238
#AQ=`echo "1/(23809.5238095238/(16384/2))" | bc -lq`
cp fid fid.bin
ls fid.bin | cpio -o | cpio -i --swap -u
od -An -t dI -v -w8 fid.bin| gawk '{print NR,$1,$2}'| sed '1,64d' >fid.asc1
pynmr $SW $TD $O $SFO
makespec

pynmr:
#!/usr/bin/python2.6
import sys
#print str(sys.argv)
sweepwidth=float(sys.argv[1])
nopts=int(sys.argv[2])
centrefreq=float(sys.argv[3])
basefreq=float(sys.argv[4])

aq=1/(sweepwidth/(nopts/2))
#print str(sweepwidth),str(nopts)
f=open('fid.asc1','r')
g=open('fid.asc','w')
for line in f:
    line=line.rstrip('\n')
    line=line.split(' ')
#    print line
    freq=float(line[0])/(nopts/2)*sweepwidth+(centrefreq-sweepwidth/2)
    line[0]=(float(line[0])/(nopts/2))*aq
    g.write(str(line[0])+'\t'+str(line[1])+'\t'+str(line[2])+'\t'+str(freq)+'\n')
f.close
g.close

makespec:

#!/bin/bash
octave --silent --eval "fid=load('fid.asc');
#make xaxis
[nopts b]=size(fid);
aq=max(fid(:,1));
sw=nopts/aq;
freqx=linspace(0,sw,nopts)';

#apodizing
lb=5/10000;
fid(:,2)=fid(:,2).*exp(-lb.*freqx);
fid(:,3)=fid(:,3).*exp(-lb.*freqx);

#phasing
spec=[fid(:,1) real(fftshift(fft(fid(:,2)+i*fid(:,3)))) imag(fftshift(fft(fid(:,2)+i*fid(:,3))))];
[a b]=size(spec); spec(a/2,2:3)=[0 0];
phc=linspace(0,2*pi,180);
maxsig=0;k=1;
for n=1:180;
        localmax=max( real( (spec(:,2)+i*spec(:,3)).*exp(i*phc(n)) ));
        if (localmax>maxsig)
                maxsig=localmax;
                k=n;
        endif
endfor;
#simple baseline
absd=inline('m+t*0','t','m');
guess=0;
[f m kvg iter corp covp covr stdresid z r2]=leasqr(fid(:,4),real((spec(:,2)+i*spec(:,3)).*exp(i*phc(k))),guess,absd);
#disp(m)
#disp(sqrt(diag(covp)))

#make spectrum
spectrum=[fid(:,4) real((spec(:,2)+i*spec(:,3)).*exp(i*phc(k)))-m imag((spec(:,2)+i*spec(:,3)).*exp(i*(phc(k)+pi/2)))-m];

#fitting
pkg load optim
[a b]=max(spectrum(:,2));
centre=fid(b,4);
guess=[10 max(spec(:,2))]; #centre width height
#disp(guess)
lorentzian=inline('p(2)*(1/pi)*(p(1)/2)./((t-centre).^2+(0.5*p(1))^2)','t','p');
[f p r2]=leasqr(fid((b-150):(b+150),4),spectrum((b-150):(b+150),3),guess,lorentzian);

#filter out artefacts from fitting set
filtered=[0 0];
res=floor((max(fid(:,4))-min(fid(:,4)))/nopts);
for l=(b-ceil(5*p(1)/res)):(b+5*ceil(p(1))/res)
delta=lorentzian(fid(l,4),p)-spectrum(l,2);

if (delta>(lorentzian(fid(l,4),p))/1.2)
# do nothing
else
filtered=[filtered; fid(l,4) spectrum(l,2)];
endif
endfor

filtered=[ filtered(2:size(filtered(:,2)),1) filtered(2:(size(filtered(:,2))),2)  ];
[f p r2]=leasqr(filtered(:,1),filtered(:,2),p,lorentzian);

#disp(p')
#disp(r2)
params=[centre centre/67.8 max(lorentzian(fid(:,4),p)) p(1) 1.000 p(2)];
disp(params)
#save
spex=[fid(:,4) real((spec(:,2)+i*spec(:,3)).*exp(i*phc(k)))-m imag((spec(:,2)+i*spec(:,3)).*exp(i*(phc(k)+pi/2)))-m lorentzian(fid(:,4),p)];
save spectrum.dat spex;"